Demonstration on open data
GIS atlas of a sewer network to the RAEPA data standard
A sewer network published as open data, restructured to the French RAEPA data standard, checked pipe by pipe and laid out as an atlas sheet.
Demonstration on open data
A sewer network published as open data, restructured to the French RAEPA data standard, checked pipe by pipe and laid out as an atlas sheet.
This is not a client assignment: I built it on public data to show engineering and environmental consultancies how I work as a subcontractor.
An engineering firm taking over a network plan inherits data entered by many hands over many years: reversed flow directions, manholes without invert levels, missing connections.
Before drawing the atlas, you need to know what the data is worth, and be able to tell the client, with figures.
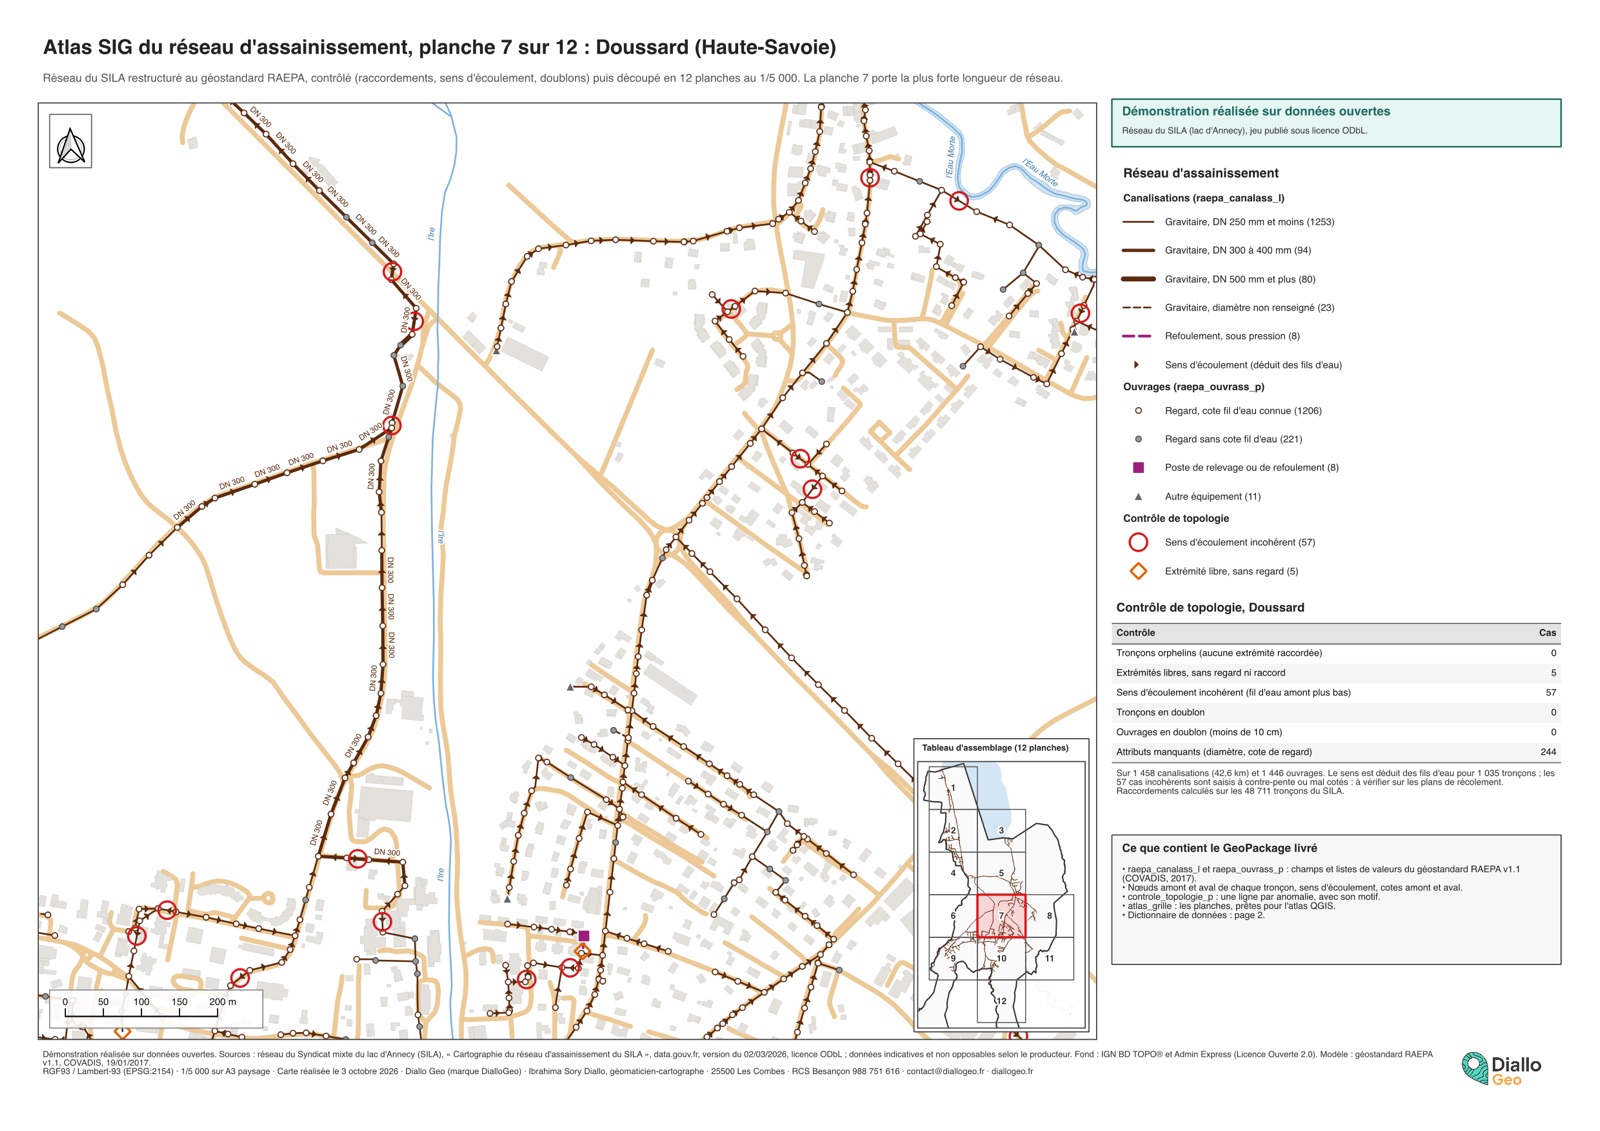
57pipes with an inconsistent flow direction in the municipality
The flow direction could be computed on 1,035 pipes. An inconsistent direction does not say where the error is: pipe digitised backwards, wrong manhole level or a real reverse slope. Only an as-built plan or a site visit can tell; the anomaly layer lets you work through the cases one by one.
The check covers the data as published: it replaces neither an as-built plan nor an inspection. No sewer network is published as open data in Bourgogne-Franche-Comté, so the demonstration uses the most complete dataset found, the SILA one.
I work as a subcontractor: data structuring and quality checks, maps and atlases, in your house style and under your name if you wish. QGIS, GeoPackage and PDF deliverables.
Reply within 24 business hours, quote within 3 business days.